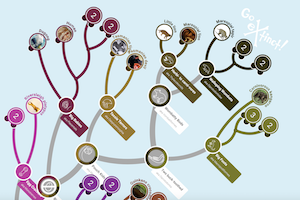
This is the online version of the board game GoExtinct!, where the user can choose different phylogenies, colors and species.
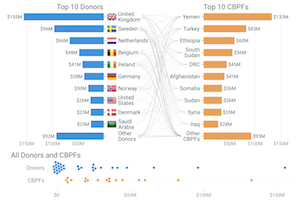
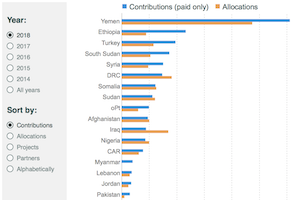
A datavis showing the relationships between donor and recipient countries, made for United Nations, Office for the Coordination of Humanitarian Affairs.
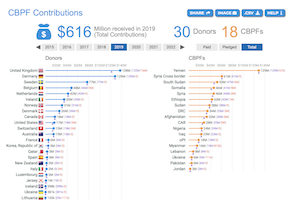
A series of data visualizations for a new BI page, made for United Nations, Office for the Coordination of Humanitarian Affairs.
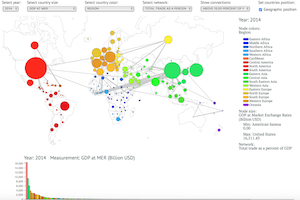
A force-directed graph with geographic encoding showing global trade, made for the Pardee Center, University of Denver.
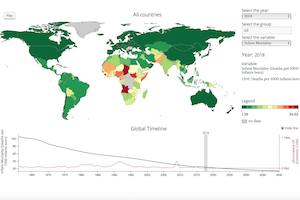
A complex mix of choropleth map and line charts showing economic vulnerabilities, made for the Pardee Center, University of Denver.
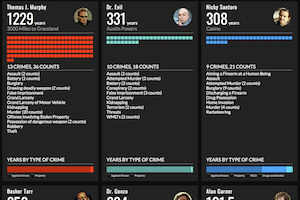
A funny data visualization, showing the prison time that 13 Las Vegas movie criminals could have faced.
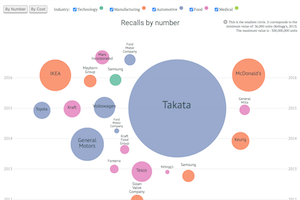
A series of data visualizations made for the special “A short history of product recalls”, from the Strategic Risk magazine.
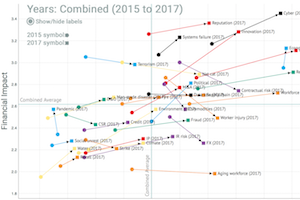
An interactive scatter plot chart showing Australia’s top risks, made for the Strategic Risk magazine.
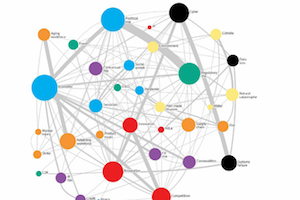
A force-directed graph showing economic risks, made for the StrategicRISK Annual Risk Report reports on the connectivity of risks.
A datavis showing multi-donor humanitarian donations, made for United Nations, Office for the Coordination of Humanitarian Affairs.